| Table of Contents | ||||||||||
|---|---|---|---|---|---|---|---|---|---|---|
|
Swarm UI Monitoring
Make it part of a routine to check the Swarm Storage UI to monitor for problems with an Elasticsearch cluster.
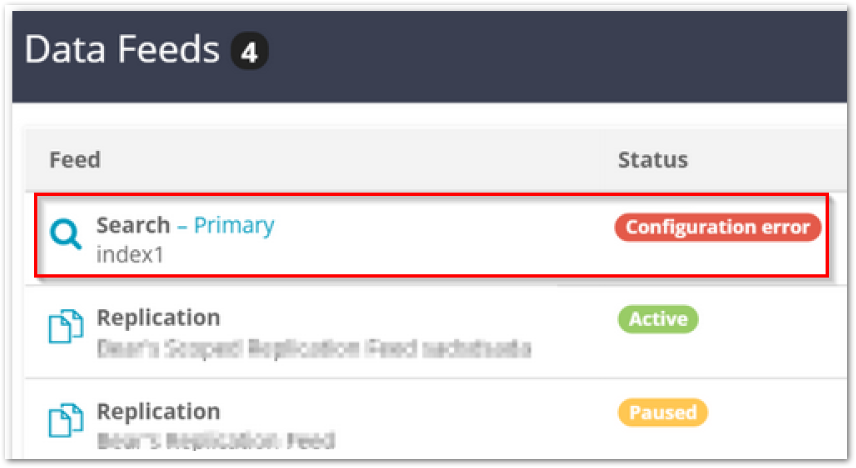
Navigate to Cluster > Feeds to monitor the real-time status of the search feed. Examine the health of the Elasticsearch cluster if the Swarm search index status is yellow or red. See Search Feeds.
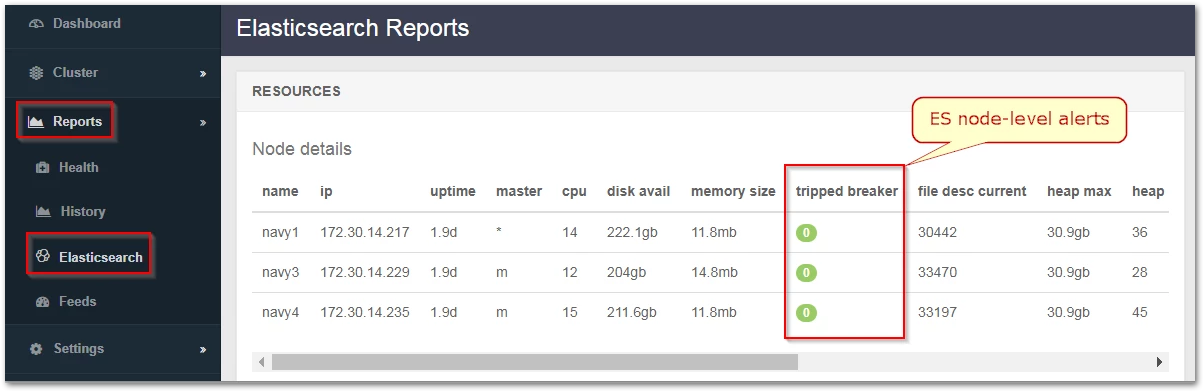
Navigate to Reports > Elasticsearch to view details and alerts. See See Elasticsearch Reports in Using Cluster Reports.
Checking ES Cluster Health
A first step to any investigation is to query one of the Elasticsearch nodes for a report on the health of the Elasticsearch cluster:
Wait until all nodes are back in service before proceeding if any Elasticsearch nodes are temporarily out of service for a known reason (such as a reboot or a rolling upgrade), .
Query the health of the cluster against one of the Elasticsearch nodes:
Code Block language bash curl -X get <ES_Server>:9200/_cat/health?vVerify the value of node.total matches the expected number of nodes in the Elasticsearch cluster.
Diagnosing and Fixing Split Brain
A split brain situation is created when one or more nodes fails in a cluster and the cluster reforms itself with the available nodes. Believing the other clusters are dead, each cluster may simultaneously access the same data, which can lead to corruption.
Perform a health check of the ES cluster (see above).
Perform the same health query against each of the other Elasticsearch nodes in the cluster if node.total is less than expected.
Elasticsearch cluster is experiencing a split-brain situation if different Elasticsearch nodes report different values for node.total.
Examine the /etc/elasticsearch/elasticsearch.yml configuration files and verify the Elasticsearch nodes are all configured correctly.
Contact DataCore Support if help is needed to verify these settings.Examine the value of the "unassign" shards. There may be a shard allocation issue that is causing the Elasticsearch cluster to have a non-green status if the value is greater than zero.
Contact DataCore Support for help in resolving this situation.