...
The Cluster section provides access to the details of a cluster's Hardware (physical or virtual machines, or chassis), Subclusters, and Feeds (search and replication).
| Info |
|---|
Streams versus Objects Streams are not objects. One object can involve many streams. Objects are the files uploaded to and download from Swarm, and they are indexed for searching and listing. Streams are all underlying data components Swarm manages internally, such as erasure-coded segments, replicas, historical versions, and chunks of multipart uploads. The Swarm UI reports on streams when it is surfacing Swarm's internal view of hardware usage. |
...
The primary initial view of the cluster is offered through the Dashboard. The Dashboard presents real-time visual monitoring, alerting, and history across the cluster's usage and activity. The host name and last refresh time for the page are shown at the top. The page auto-refreshes every 60 seconds.
| Info |
|---|
Empty dashboard The top of the page shows a Swarm watermark background if the cluster does not have an active license. Attempt to log out and log in again if the license is active but the data is still missing. |
...
Health | Cluster Overall cluster health as a red, yellow, green status based on the status of the cluster's chassis and disks. Drill down to the Health Report for additional details. 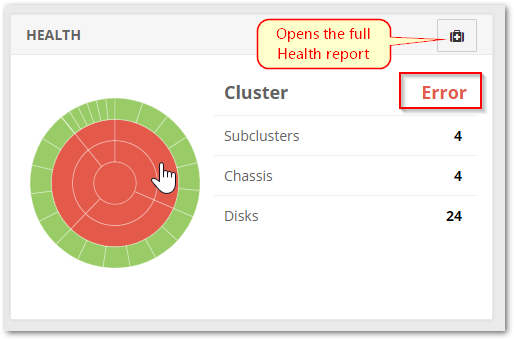
Note Per-object feed errors (for replication or search indexing) do not generate critical log messages and so do not change the node state to 'error'. Check the Feeds section of the Dashboard for blocked feeds. | |||
|---|---|---|---|---|
Usage | Disk space % of Disk space usage in the cluster, including free space, used space and trapped space. The Disk space pie chart turns orange if the amount of used capacity exceeds 80% and then red if the capacity exceeds 90%. Mouse over each segment in the pie chart for more information. | |||
Stream index % of Stream index usage in the cluster, including how much is used by the overlay index if any. The Stream index pie chart turns orange if the amount of used RAM exceeds 80%, and then red if the capacity exceeds 90%. Mouse over each segment in the pie chart for more information. 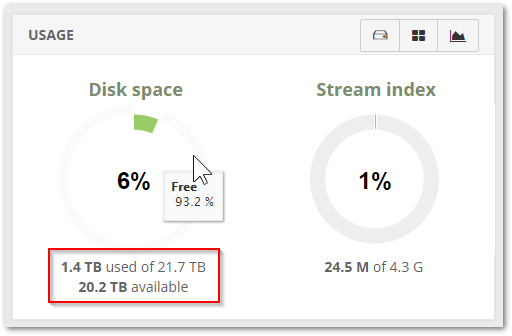 | ||||
Elasticsearch | Statistics The Elasticsearch panel provides a snapshot of the ES cluster's status and essential statistics. Click the icon for the full report for details. 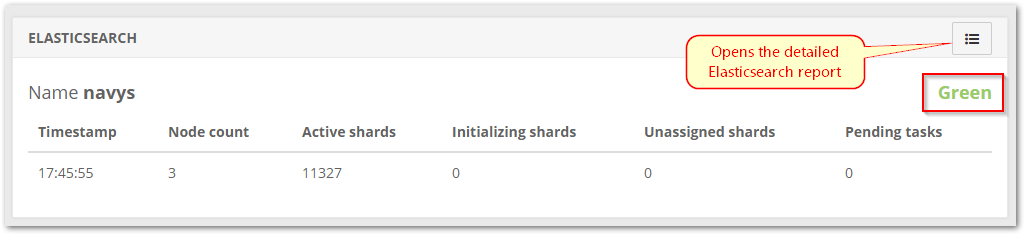 | |||
Feeds | One pane per feed Status for each feed, both search and replication, including current feed status, a trended graph of feed event processing over time, and a count by stage (Pending, Processing, Retrying) of any queued events and deletes. An animated spinning icon displays to indicate the feed is currently processing if queue for events or deletes is greater than zero.
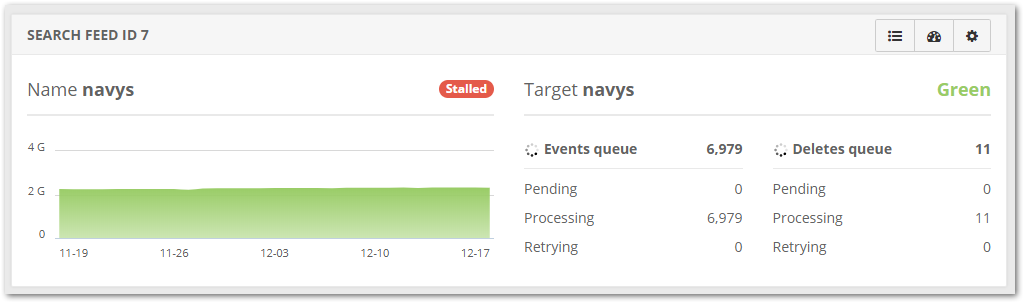 | |||
Network Traffic | Request The count of each SCSP method type in incoming client requests over a rolling 30 day window. | |||
Responses The count of HTTP response codes returned to clients by the storage cluster over a rolling 30 day window. 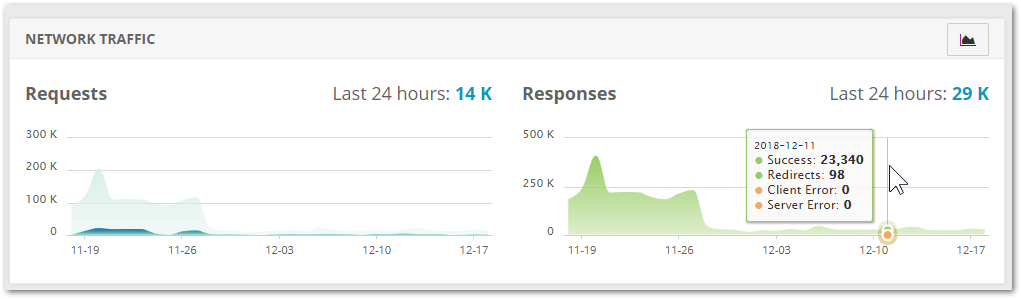 |
...
The settings gear icon at the top of the page allows restarting or shutting down the entire storage cluster, as well as the ability to clear logs.
| Info |
|---|
Admin only These cluster-wide actions require authentication as an administrator. |
...